12 Easy Steps to Value Any Stock
2024-03-05
Last update on 2024-04-12
Learn how to quickly evaluate public company stocks with our straightforward 12-step guide. Perfect for investors seeking clarity and precision.
Valuing a company is crucial and usually a pretty tedious activity for investors. It involves having the right quantity and quality of fundamental data and assessing various factors and indicators to determine the intrinsic value of a business.
In this article, we will explore a method to calculate the valuation of a company based on a set of 12 key criteria. Each criterion plays a significant role in stock valuation analysis and provides insights into the company's financial health and growth prospects.
Attention, spoiler alarm - marketstorylabs.com will make this a breeze for you.

We are going to look at the following 12 criteria that can be highly relevant to calculate the valuation of a company. At marketstorylabs.com, we have tested our full selection of more than 5K public companies worldwide against those carefully curated set of criteria. Let's look at them...
- Criterion 1: Price to Earnings (P/E) ratio is smaller than the average of the industry
- Criterion 2: Price to Book (P/B) ratio is smaller than the average of the industry
- Criterion 3: Price to Sales (P/S) ratio is smaller than the average of the industry
- Criterion 4: Price/Earnings-to-growth (PEG) ratio is smaller 1
- Criterion 5: Price/Earnings-to-growth (PEG) ratio is smaller than average of industry
- Criterion 6: Revenue been stable in the past 20 years (Weighted factor: 2)
- Criterion 7: Revenue generally increased in the past 20 years (Weighted factor: 2)
- Criterion 8: Revenue was constantly increased in the past 20 years on every year
- Criterion 9: Revenue increased by more than 100% in the past 20 years
- Criterion 10: Enterprise-value to EBIT ratio is smaller than average of the industry
- Criterion 11: Enterprise-value to EBITDA ratio is smaller than average of industry
- Criterion 12: Enterprise-value to Revenue ratio is smaller than average of industry
We assign a factor of 2 to two specific criteria - 6 and 7, indicating their increased importance in our evaluation process. This weighting ensures that stability of revenue (criterion 6), and growth of the revenue (criterion 6), are given additional significance when determining the value of a business.
In the following sections, we will delve into each criterion, explaining why it is relevant and how it contributes to the overall valuation of a stock.
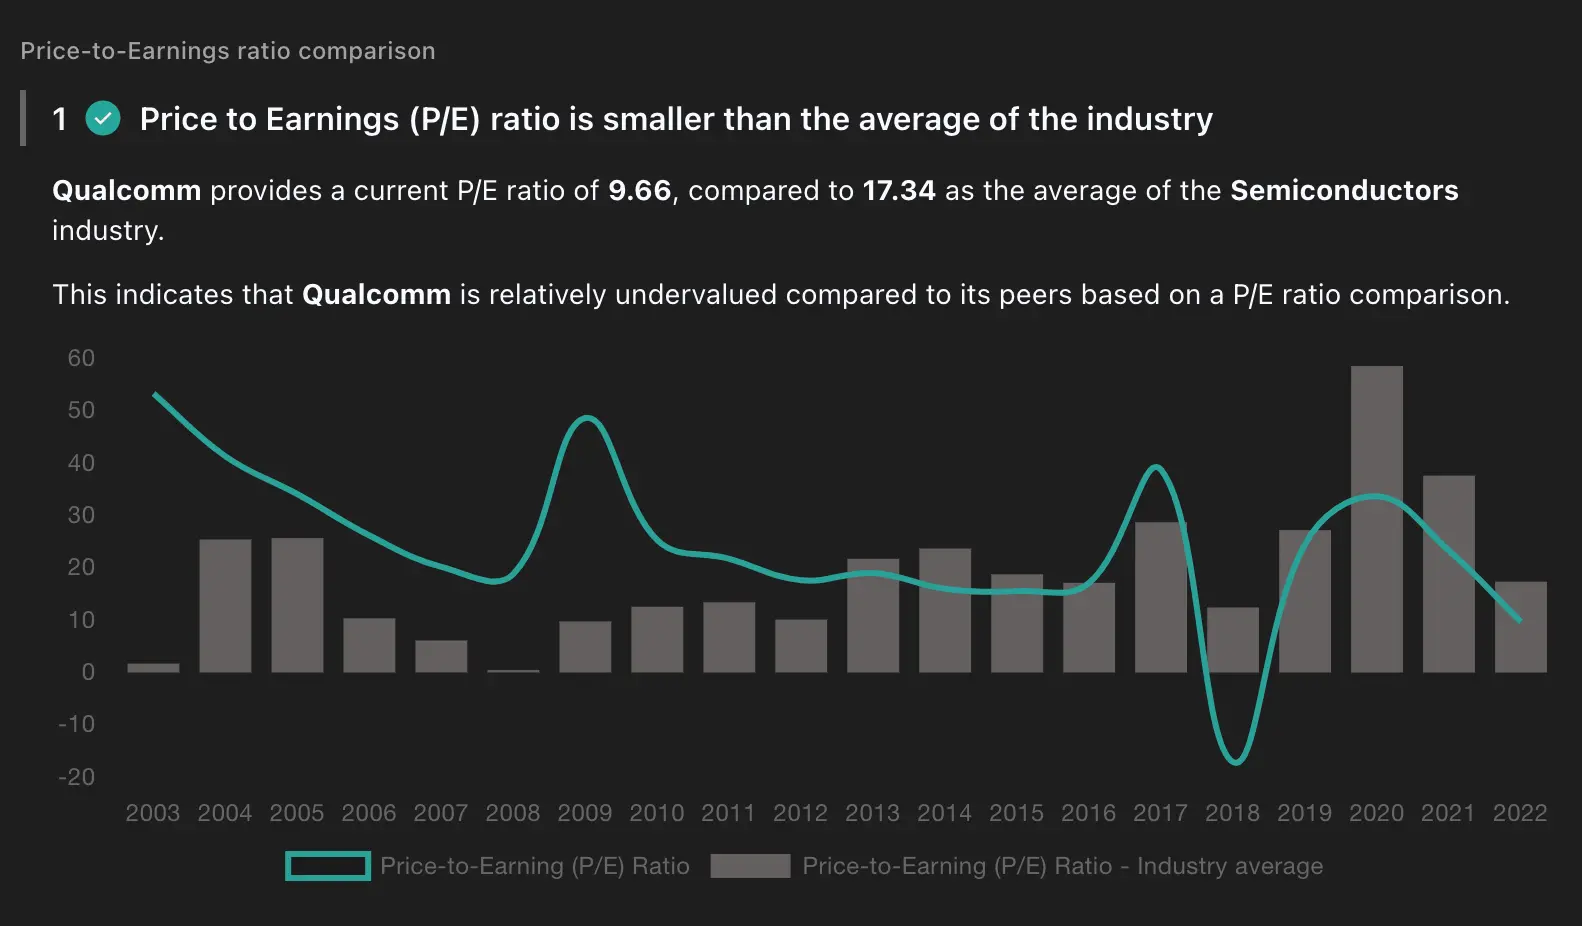
Criterion 1: Price to Earnings (P/E) ratio is smaller than the average of the industry
The P/E ratio compares the stock price with the company's earnings per share (EPS). A P/E ratio smaller than the industry average suggests that the stock is undervalued relative to its earnings potential. This criterion indicates that investors are paying less for each unit of earnings generated by the company.
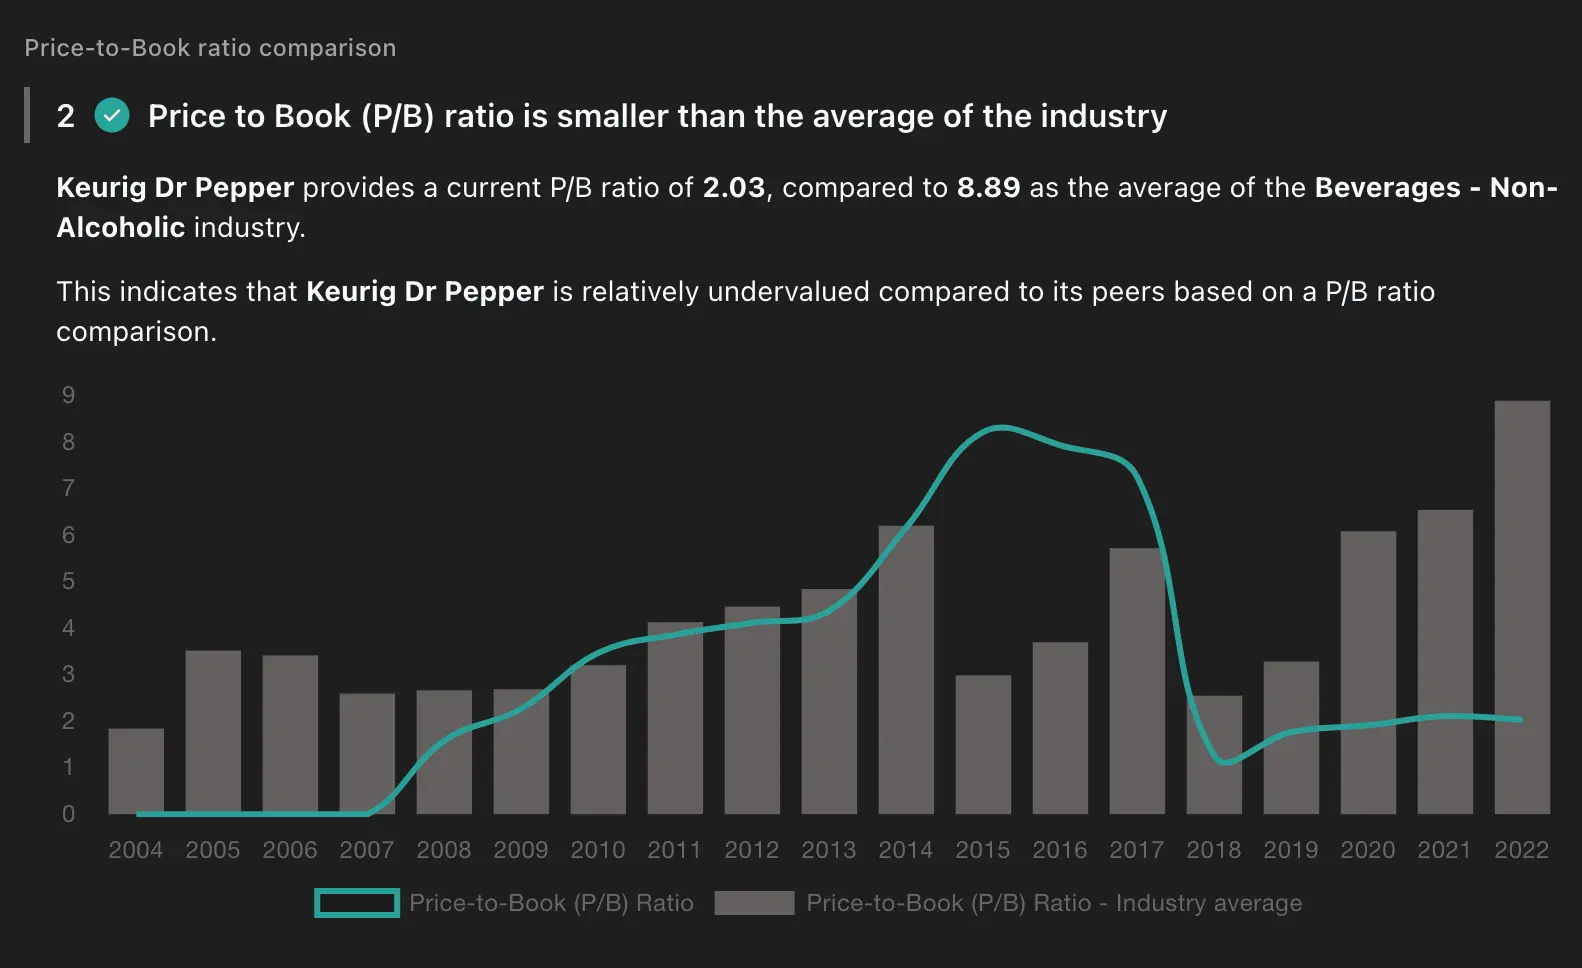
Criterion 2: Price to Book (P/B) ratio is smaller than the average of the industry
The P/B ratio compares the stock price with the company's book value per share. A P/B ratio smaller than the industry average implies that the stock is trading at a discount to its net asset value. This criterion suggests that investors have an opportunity to acquire the company's assets at a relatively lower price.
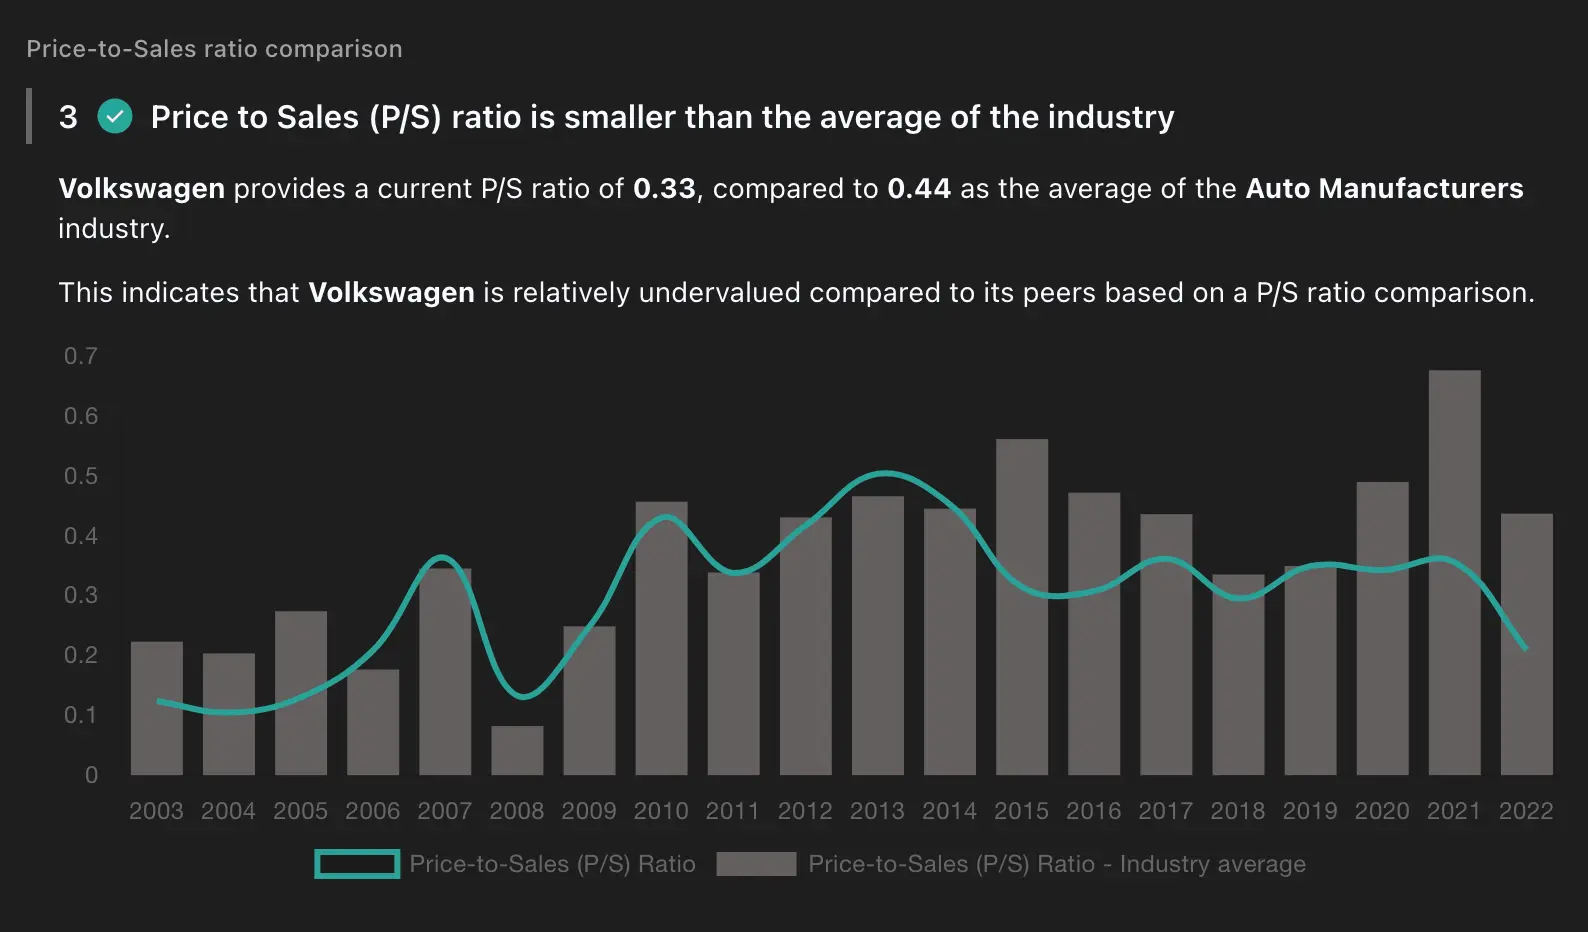
Criterion 3: Price to Sales (P/S) ratio is smaller than the average of the industry
The P/S ratio compares the stock price with the company's revenue per share. A P/S ratio smaller than the industry average indicates that the stock is undervalued in terms of its sales. This criterion highlights that investors are paying less for each unit of revenue generated by the company.
Criterion 4: Price/Earnings-to-growth (PEG) ratio is smaller
The PEG ratio assesses the relationship between a company's P/E ratio and its earnings growth rate. A PEG ratio smaller than 1 suggests that the stock may be undervalued relative to its earnings growth potential. This criterion indicates that investors can potentially benefit from both a low P/E ratio and strong earnings growth.
Criterion 5: Price/Earnings-to-growth (PEG) ratio is smaller than average of industry
Comparing a company's PEG ratio to the industry average provides additional context. If a company's PEG ratio is smaller than the industry average, it suggests that the company's growth prospects are relatively better than those of its peers. This criterion highlights the potential for above-average returns based on the company's growth trajectory.
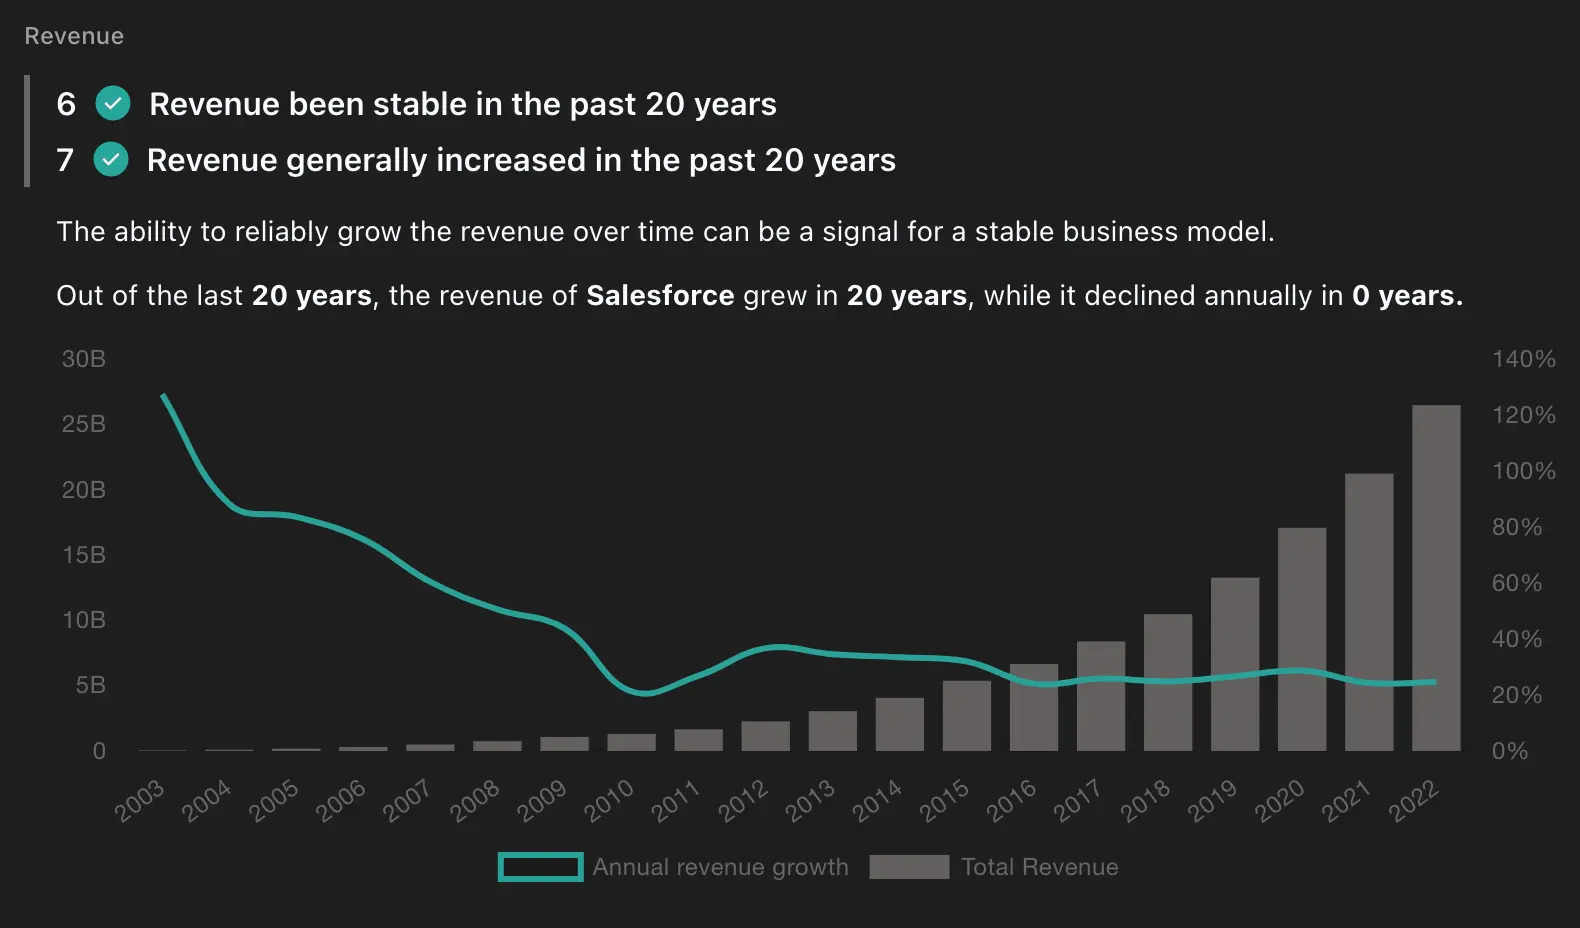
Criterion 6: Revenue been stable in the past 20 years
We hold revenue stability as a paramount criterion in our valuation analysis. To amplify its significance, we assign it a multiplier of 2. For us, revenue stability means that the company has never experienced a year-over-year decline of more than 20% in annual revenue over the past two decades. This strict standard highlights the company's ability to maintain consistent financial performance and withstand economic fluctuations. By doubling its weight, we underscore the importance of reliable revenue streams in our valuation methodology, enabling us to identify resilient and robust companies with a solid foundation for long-term success.
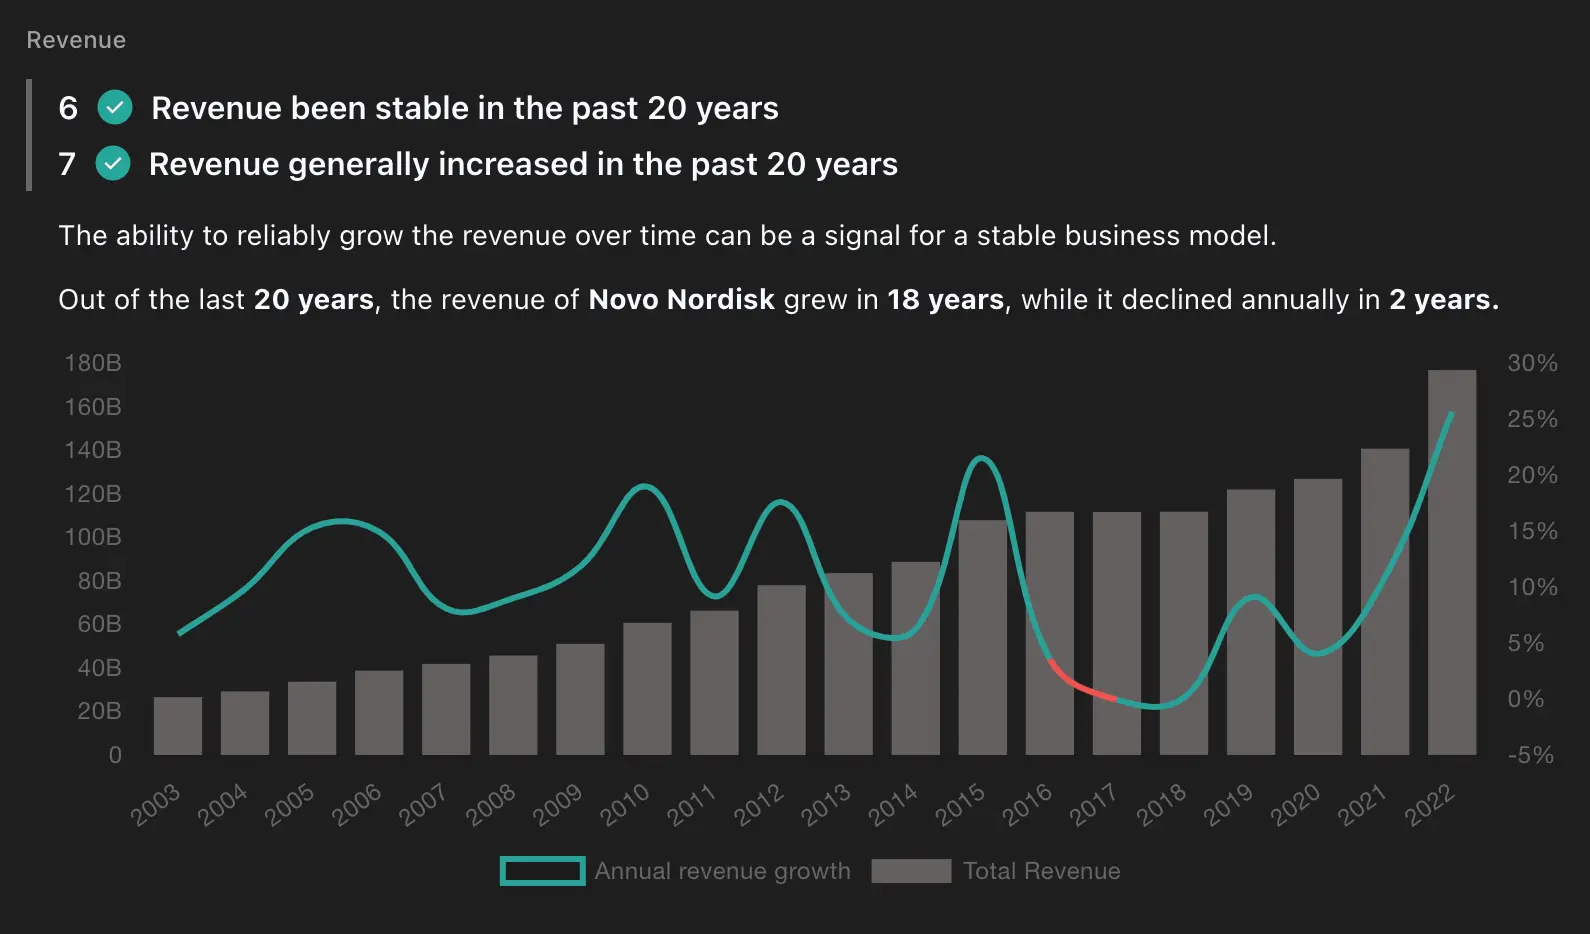
Criterion 7: Revenue generally increased in the past 20 years
We consider a company's revenue trend over the past 20 years to be of utmost importance in our valuation analysis. To emphasize this criterion, we also assign a multiplier of 2 here. A company that has experienced revenue growth over the past 20 years suggests its ability to adapt, innovate, and capture market opportunities. This criterion indicates that the company has a track record of expanding its customer base, improving products or services, and generating higher sales over time.
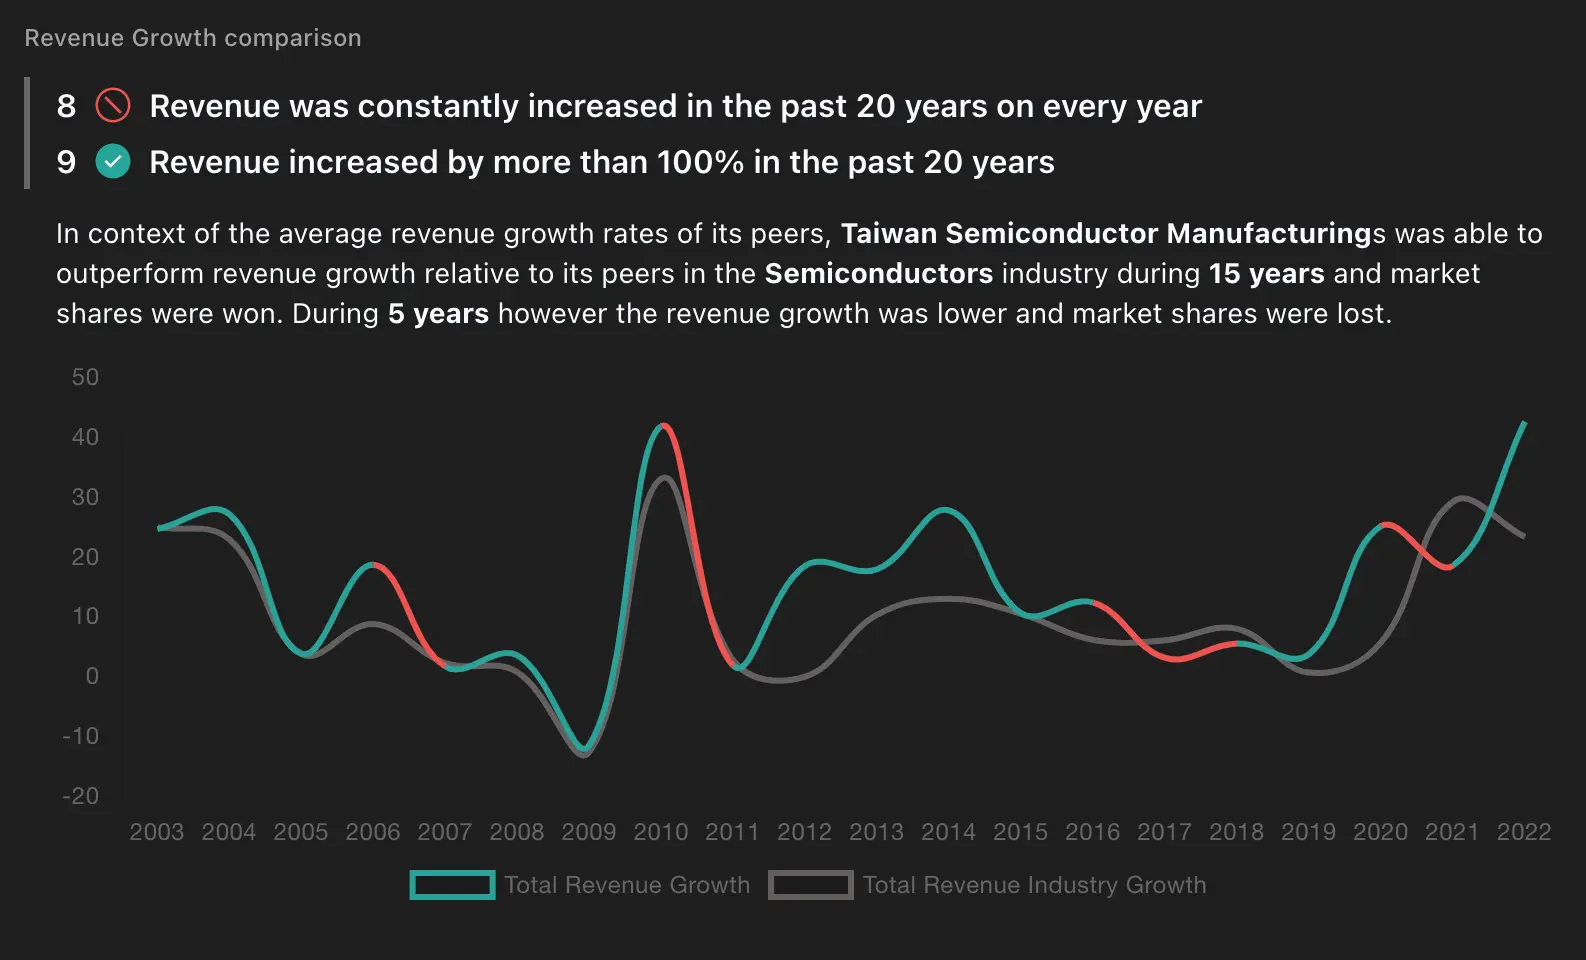
Criterion 8: Revenue was constantly increased in the past 20 years on every year
Companies that have consistently increased their revenue every year for two decades showcase a strong growth trajectory. This criterion highlights a company's ability to deliver consistent financial performance, which can be an very attractive prospect for investors seeking sustained returns.
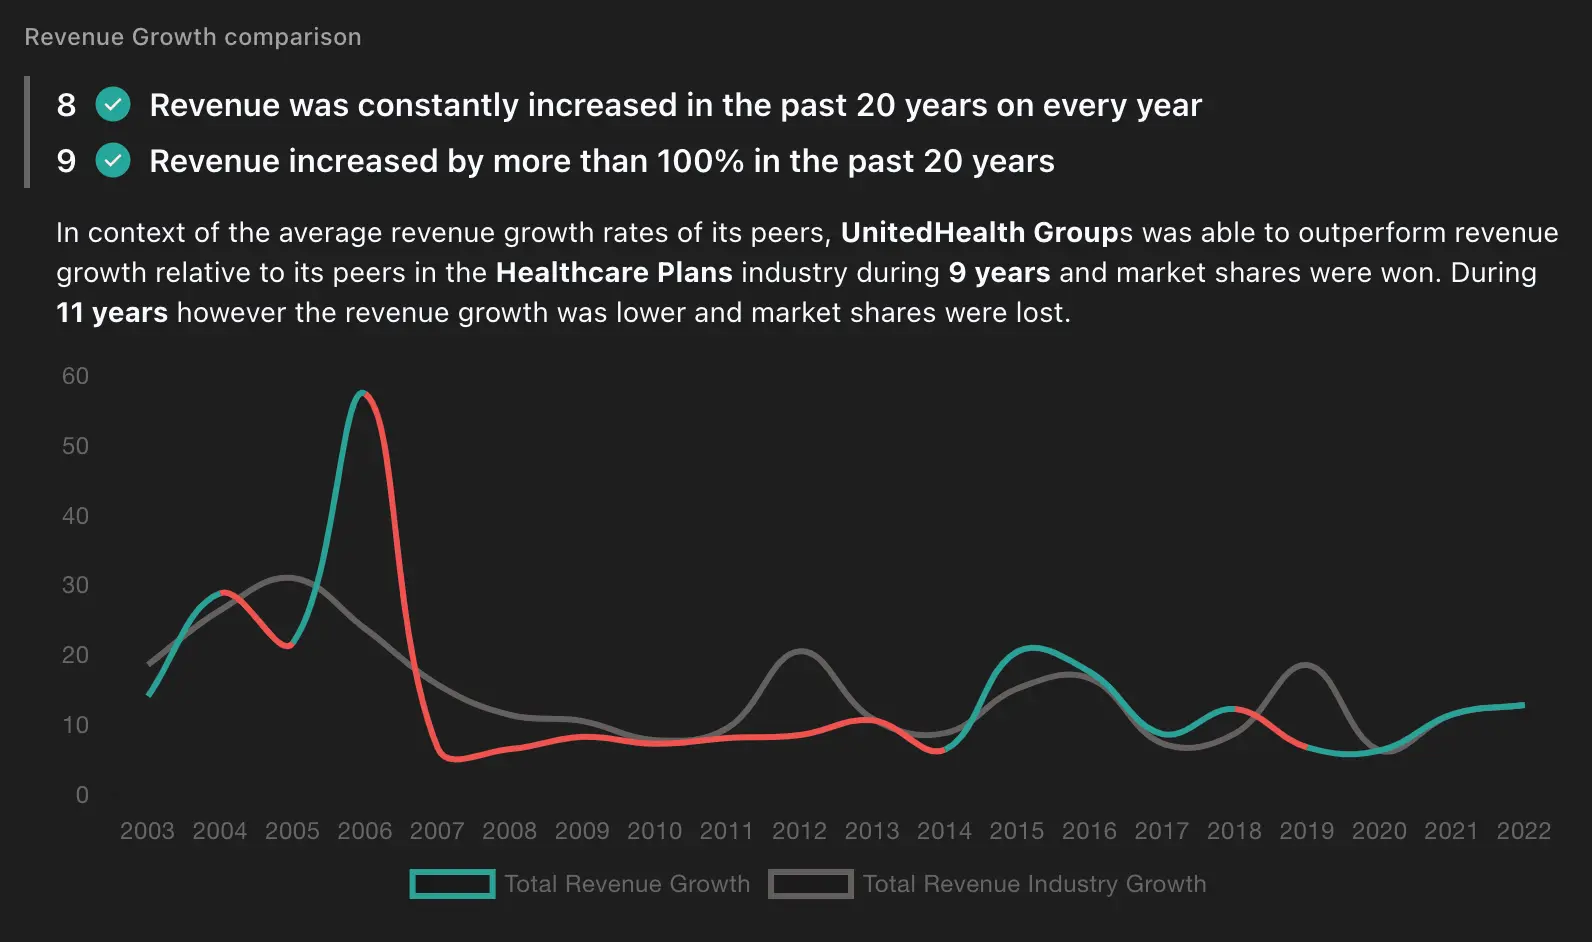
Criterion 9: Revenue increased by more than 100% in the past 20 years
A revenue increase of more than 100% over 20 years signifies substantial growth and a successful business model. This criterion showcases the company's ability to capture market share, drive sales, and generate higher profits. Investors often view such companies as attractive investment opportunities with long-term growth potential.
Criterion 10: Enterprise-value to EBIT ratio is smaller than average of the industry
The enterprise-value-to-EBIT ratio measures a company's enterprise value relative to its earnings before interest and taxes (EBIT). Comparing a company's enterprise-value-to-EBIT ratio to the industry average provides insights into its relative valuation. A ratio smaller than the industry average suggests that the stock may be undervalued, indicating that investors can potentially acquire the company at a more favorable price in relation to its earnings.
Criterion 11: Enterprise-value to EBITDA ratio is smaller than average of industry
Similar to the previous criterion, the enterprise-value-to-EBITDA ratio compares a company's enterprise value to its earnings before interest, taxes, depreciation, and amortization (EBITDA). A ratio smaller than the industry average indicates that the stock may be undervalued relative to its cash flow generation. This criterion highlights the company's ability to generate higher operating profits, making it an attractive investment opportunity.
Criterion 12: Enterprise-value to Revenue ratio is smaller than average of industry
The enterprise-value-to-revenue ratio assesses a company's valuation relative to its total revenue. Comparing this ratio to the industry average allows investors to gauge the company's valuation in relation to its sales performance. A ratio smaller than the industry average suggests that the stock may be undervalued, indicating that investors can potentially acquire the company at a more attractive price in relation to its revenue generation.
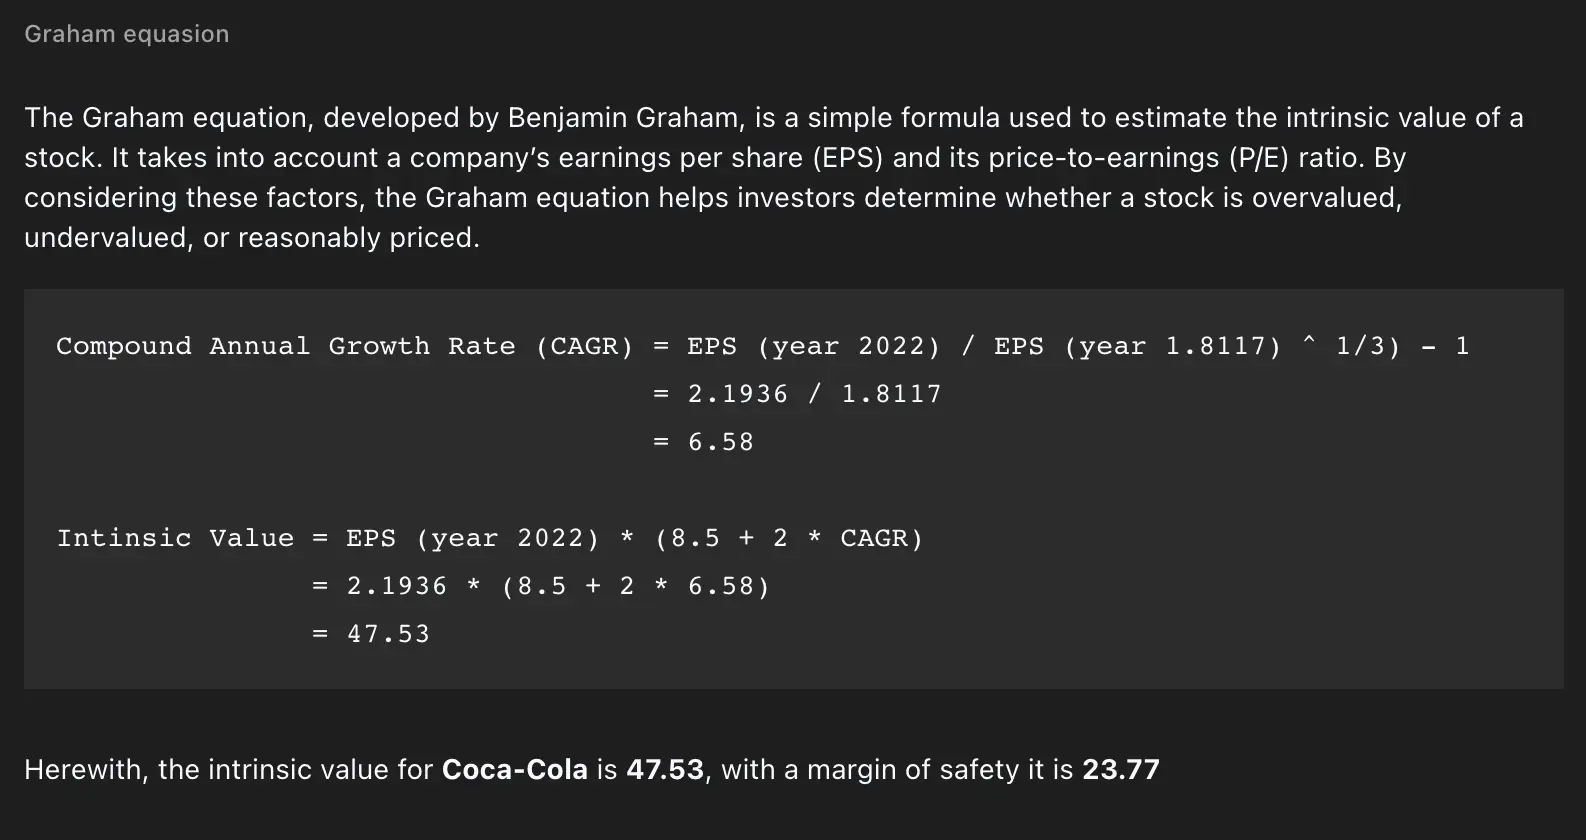
Estimating Fair Value with the Graham Equation
The Graham Equation, developed by renowned investor Benjamin Graham, provides a straightforward method for estimating the fair value of a stock. By considering a company's earnings per share (EPS) and growth rate, the equation calculates the intrinsic value of the stock.
Fair Value = (Earnings per Share) x (8.5 + 2 x (Growth Rate)) This approach offers a conservative and fundamental perspective on stock valuation. By comparing the estimated fair value to the market price, investors can identify potentially undervalued stocks.
While the Graham Equation is a useful tool, it should be complemented with other valuation methods and qualitative analysis. Factors such as industry dynamics, competition, and management quality should also be taken into account. marketstorylabs.com incorporated the Graham Equation into your calculation process to provide additional valuable insights and assist in making informed investment decisions, however we did not include the outcome of the Graham calculation in the overall Valuation Analysis result.
Conclusion
Valuing a company requires a comprehensive analysis of various criteria that provide insights into its financial health and growth potential. By considering a range of factors such as price to earnings, price to book, price to sales, PEG ratio, revenue stability, revenue growth, and enterprise-value ratios, investors can gain a more accurate understanding of a company's intrinsic value.
When the price-based ratios are smaller than the industry average, it suggests that the stock may be undervalued, presenting an opportunity for investors to potentially benefit from future price appreciation. Additionally, revenue stability and consistent growth over a significant period indicate a company's resilience and ability to adapt to market conditions.
It is crucial to note that these criteria should not be considered in isolation but rather as a part of a comprehensive analysis that also includes qualitative aspects, market trends, competitive landscape, and management quality. By combining these quantitative and qualitative factors, investors can make more informed decisions when evaluating the valuation of a company and identifying potential investment opportunities.
Remember, valuation is not an exact science, and it requires ongoing monitoring and adjustment as market dynamics evolve. Therefore, it is recommended to seek professional advice and conduct thorough due diligence before making any investment decisions.
Start on your path to financial success by exploring the world of stocks on marketstorylabs.com - simple, proficient, and free.
Obligatory risk notice
We would like to point out that the contents of this website are for general information purposes only and do not constitute recommendations for the purchase or sale of specific financial instruments, and therefore do not constitute investment advice. In particular, marketstorylabs.com and its creators cannot assess the extent to which information / recommendations made on the pages correspond to your investment objectives, your risk tolerance and your ability to bear losses. Therefore, if you make any investment decisions based on information on the site, you do so solely on your own responsibility and at your own risk. This in turn means that neither marketstorylabs.com nor its creators are liable for any losses incurred as a result of investment decisions based on the information on the marketstorylabs.com website or other media used.