Value Investing with Piotroski
2024-03-05
Last update on 2024-04-11
The Use of Historical Financial Statement Information to Separate Winners from Losers - Piotroski F-Score
In the world of investing, strategies that aim to identify undervalued companies with the potential to outperform the market have long been sought after. One such strategy is the Piotroski F-Score, developed by Joseph Piotroski, an accounting professor. This strategy utilizes historical financial statement information to distinguish financially strong companies from weaker ones. In this article, we explore the principles behind the Piotroski F-Score and its potential as a value investing tool.

Promising Results and Market Performance
Various academic studies have examined the effectiveness of the Piotroski F-Score strategy, with many finding that investing in companies with high scores can potentially yield excess returns compared to those with low scores. One notable paper supporting the strategy's success is "Value Investing: The Use of Historical Financial Statement Information to Separate Winners from Losers" by Joseph Piotroski himself, which can be found at the original paper.
Understanding the Piotroski F-Score
The Piotroski F-Score comprises nine financial criteria that assess various aspects of a company's financial health. These criteria include positive net income, positive operating cash flow, improvements in earnings quality, cash flow from operations exceeding net income, reductions in long-term debt, increases in the current ratio, gross margin, and asset turnover, as well as the absence of stock dilution. By assigning a score of 0 or 1 to each criterion and summing them up, a company's overall F-Score is obtained, providing an indication of its financial strength. The following picture explains the financial strength:

Calculating Piotroski F-Score
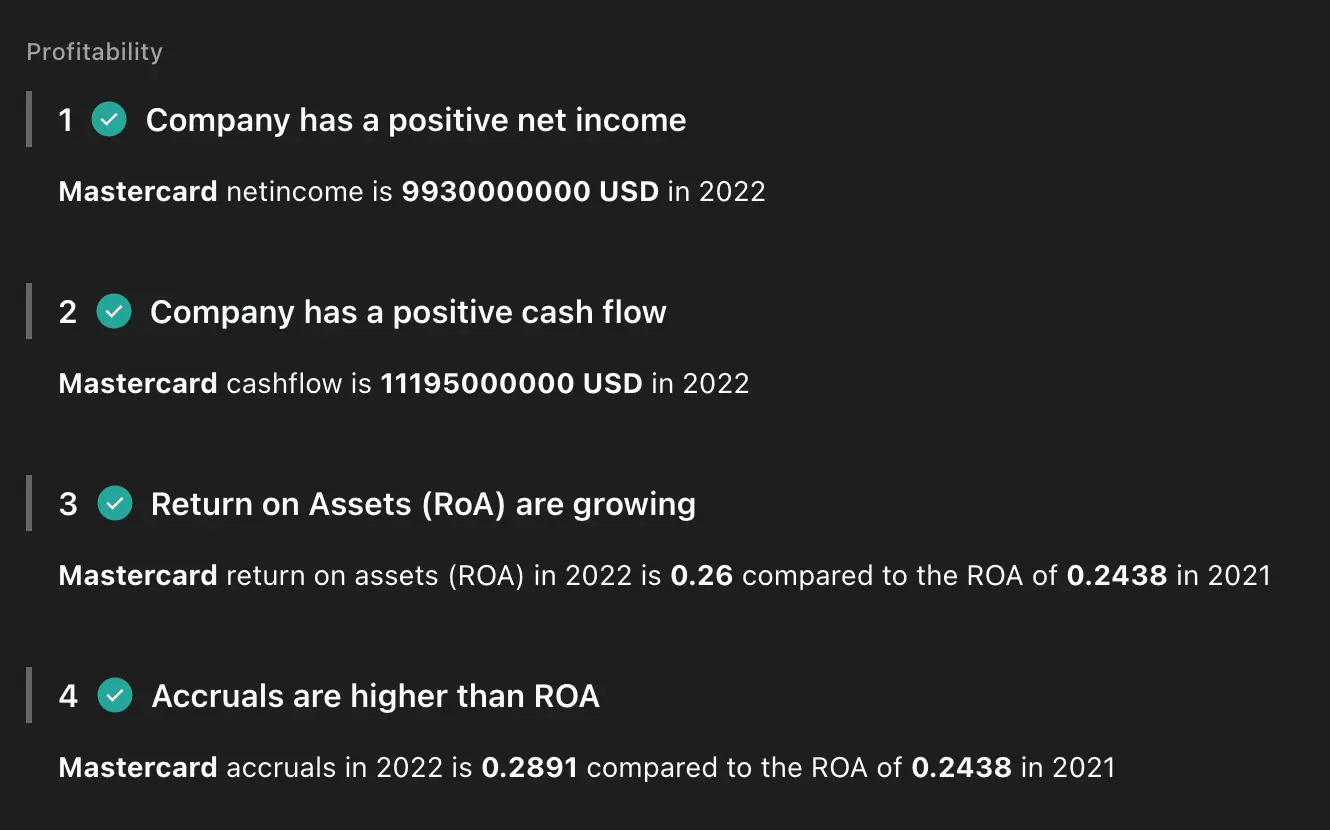
1. Profitability
- Positive Net Income
The company receives a score of 1 if it has reported positive net income in the current year, indicating profitability. Otherwise, it receives a score of 0. - Positive Operating Cash Flow
If the company generates positive operating cash flow in the current year, it is considered a positive indicator of profitability and receives a score of 1; otherwise, it receives a score of 0. - Improvements in Earnings Quality
This criterion compares the company's return on assets (ROA) in the current year to the previous year. If the ROA has increased, indicating improved earnings quality, the company receives a score of 1; otherwise, it receives a score of 0. - Cash Flow from Operations > Net Income
This criterion compares the company's cash flow from operations to its net income. If cash flow from operations exceeds net income in the current year, it is considered a positive indicator of the quality of earnings and receives a score of 1; otherwise, it receives a score of 0.
For example:
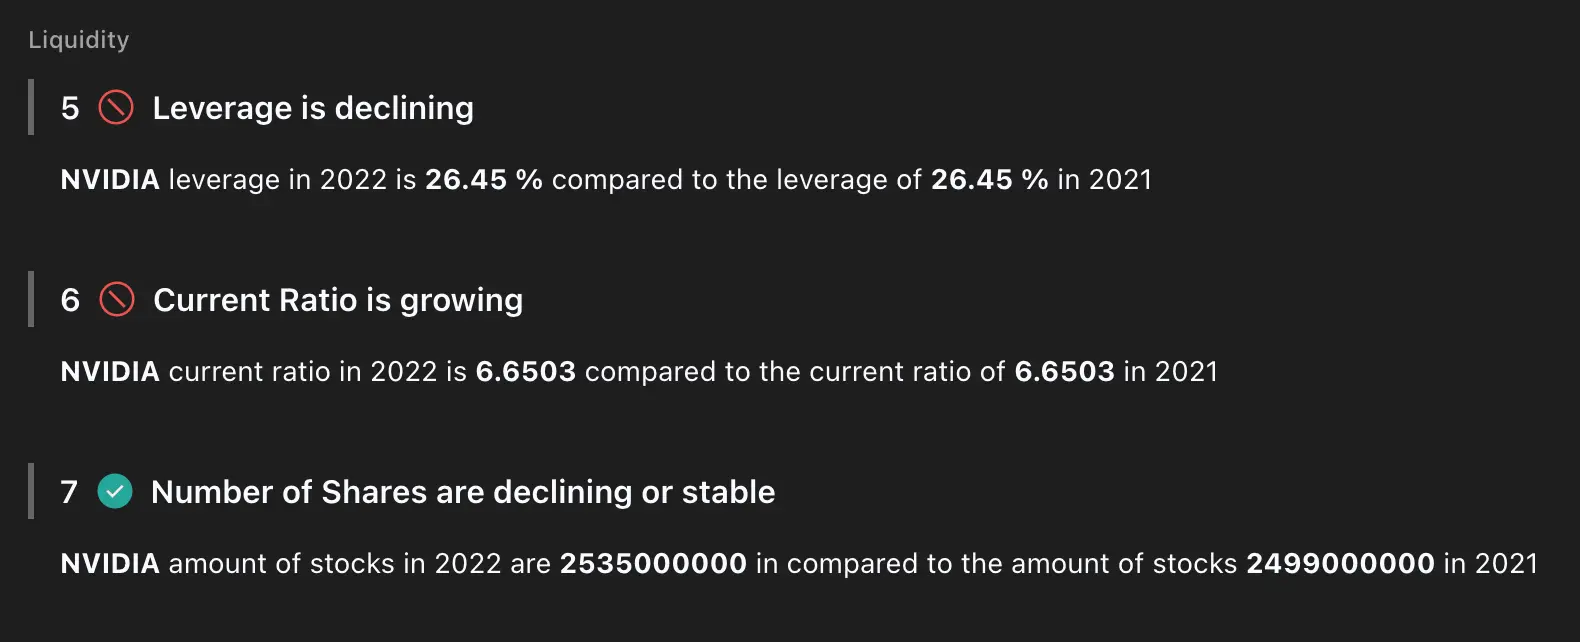
2. Leverage, Liquidity and Source of Funds
- Decrease in Long-Term Debt
If the company has reduced its long-term debt in the current year, it receives a score of 1, indicating a lower leverage position. If the long-term debt has not decreased, it receives a score of 0. - Increase in Current Ratio
The current ratio, calculated by dividing current assets by current liabilities, measures a company's short-term liquidity. If the current ratio has improved compared to the previous year, the company receives a score of 1; otherwise, it receives a score of 0. - No Dilution
If the company has not issued additional shares of stock in the current year, it receives a score of 1; otherwise, it receives a score of 0.
For example:
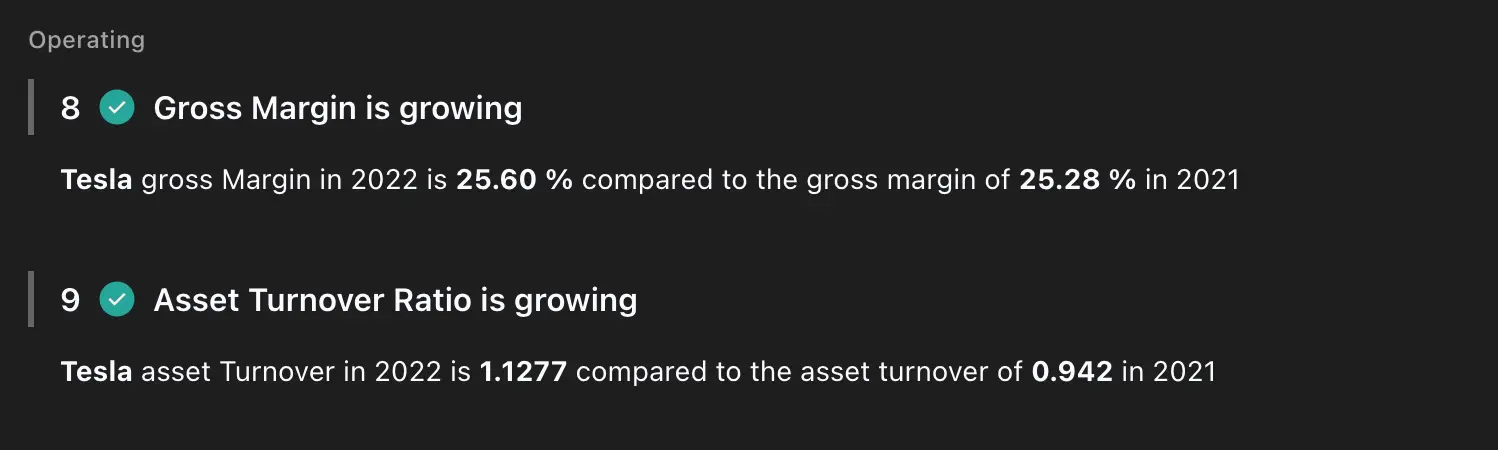
3. Operating Efficiency
- Increase in Gross Margin
The gross margin, calculated by dividing gross profit by sales, measures a company's profitability after accounting for production costs. If the gross margin has increased compared to the previous year, the company receives a score of 1; otherwise, it receives a score of 0. - Increase in Asset Turnover
The asset turnover ratio, calculated by dividing sales by total assets, assesses a company's efficiency in generating sales from its assets. If the asset turnover has increased compared to the previous year, the company receives a score of 1; otherwise, it receives a score of 0.
For example:
How to use Piotroski F-Score
The initial idea behind the Piotroski F-Score was to identify financially strong companies among those with a low price-to-book (PB) ratio. Joseph Piotroski's original research focused on value investing and sought to uncover undervalued companies that had the potential for improvement and subsequent stock price appreciation.
Piotroski recognized that not all companies with a low PB ratio are good investment candidates. Therefore, he developed the F-Score as a way to differentiate financially strong companies within this group. By combining financial criteria and assigning scores, the F-Score helps investors identify companies with potential for financial improvement and increased value.
The PB ratio primarily focuses on tangible assets, such as physical property, equipment, and inventory. In today's economy, many companies possess significant intangible assets, such as intellectual property, brand value, and customer relationships.
"These intangible assets are not fully reflected in the book value, making the PB ratio less meaningful in evaluating such companies."
Let's go:
- Identify a group of companies
Start by selecting a group of companies that you are interested in or want to evaluate for investment. - Gather the necessary financial data
Obtain the financial statements of the selected companies, including the income statement, balance sheet, and cash flow statement. Ensure you have access to the required financial data, such as net income, operating cash flow, long-term debt, current assets, current liabilities, gross profit, and sales. - Calculate the Piotroski F-Score
Apply the Piotroski F-Score criteria to each company based on their financial data. Assign a score of 1 or 0 to each criterion, as described earlier, and sum up the scores to obtain the overall F-Score for each company. - Set a minimum F-Score threshold
Determine a minimum F-Score threshold that you consider acceptable for investment. This threshold will depend on your risk tolerance and desired level of financial strength in the companies you want to invest in. - Filter financially strong companies
Filter out the companies that do not meet your minimum F-Score threshold. Focus on the companies that have achieved higher scores, indicating better financial health according to the Piotroski F-Score criteria.
How to find these companies?
You can jump into a detailed analyses view on any company like Microsoft (MSFT) to do your informed investment decision.
However, it is crucial to recognize that no investment strategy guarantees consistent market-beating performance. Market conditions, economic cycles, and unforeseen events can impact investment outcomes. The F-Score strategy focuses solely on financial metrics and may not capture all factors influencing stock performance, such as industry trends and management quality. Combining the F-Score strategy with other analysis methods and maintaining a diversified portfolio is advisable.
Conclusion
The Piotroski F-Score strategy presents a systematic approach to identify financially strong companies for potential investment. By leveraging historical financial statement information, this strategy aims to separate winners from losers. While academic studies and the original paper by Joseph Piotroski provide evidence of the strategy's potential, investors should exercise caution, conduct thorough research, and consider their own risk tolerance and investment goals.
Remember, investing involves risks, and no strategy can guarantee market-beating results. Consulting with financial professionals and staying informed about market trends are crucial elements of successful investing. The Piotroski F-Score offers valuable insights into a company's financial health, but it should be used in conjunction with a comprehensive investment approach to maximize the potential for investment success.
Start on your path to financial success by exploring the world of stocks on marketstorylabs.com - simple, proficient, and free.
Obligatory risk notice
We would like to point out that the contents of this website are for general information purposes only and do not constitute recommendations for the purchase or sale of specific financial instruments, and therefore do not constitute investment advice. In particular, marketstorylabs.com and its creators cannot assess the extent to which information / recommendations made on the pages correspond to your investment objectives, your risk tolerance and your ability to bear losses. Therefore, if you make any investment decisions based on information on the site, you do so solely on your own responsibility and at your own risk. This in turn means that neither marketstorylabs.com nor its creators are liable for any losses incurred as a result of investment decisions based on the information on the marketstorylabs.com website or other media used.